July 22, 2020
 By Lesley Curtis, Research fellow at PSSRU
In July 2018, Amanda Burns posted our first ‘Unit Costs – Last Chapter’ related blog on the PSSRU website in which she talked about section V of the Unit Costs Report and the wealth of extra information we keep here. The information taken out of recent editions of our report and placed in this section was the particular focus of Amanda’s blog and, since it was published, some readers have taken the time to let us know that there are new studies which could fill in some of these information gaps. Success – and thank you to those readers as we are constantly searching for new service costs.
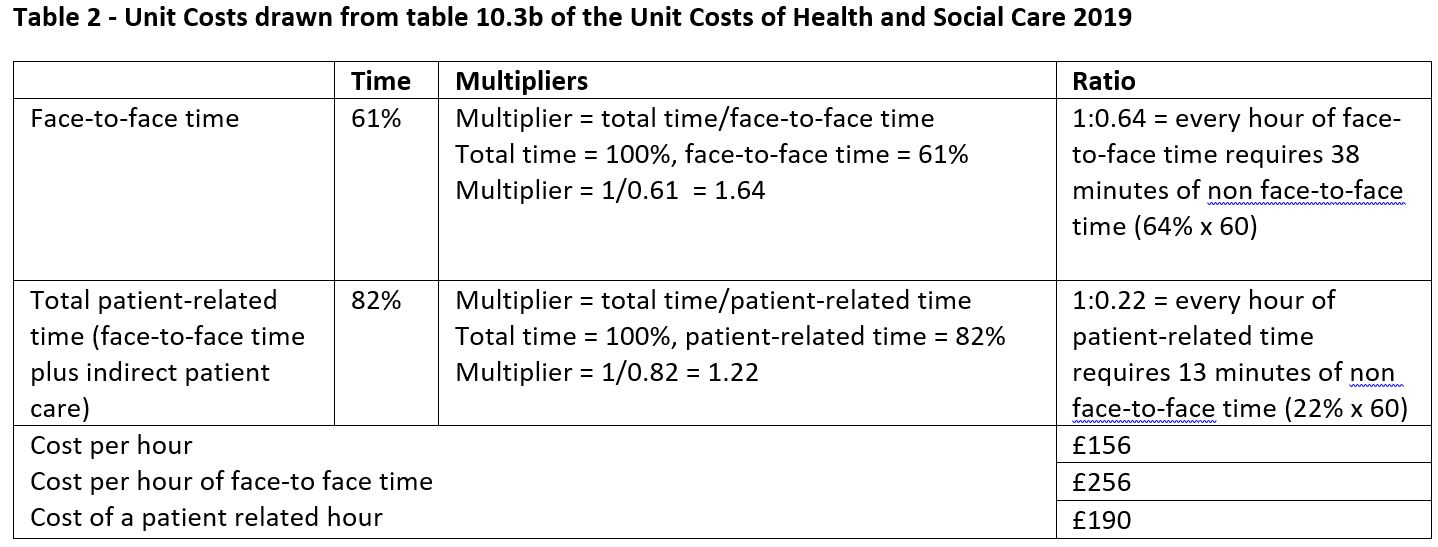
Regular users of the Unit Costs Report will see that some of our services include a ratio of direct to indirect time and that, when this ratio appears in our notes, we have calculated a cost per patient-related time or a cost per face-to-face time alongside our standard hourly cost. These costs are important as they tell us how much it costs to see patients/clients while excluding time which generates separate outputs to patient care, for example teaching. However, what may be confusing is that, over the years, patient-related costs in our report come and go and you are left with a note which refers you to section V mentioned above.
In section V, chapter 20- Time Use of Community Care Professionals, we publish ratios of direct to indirect time.
Now if you need a cat nap here, it’s ok to have a quick one, but do please then read on as we are about to clear up several points we have been asked on this particular topic over the years.
Why do we need to have a unit cost for patient contact time and how is this created?
In our database of articles commissioned for the Unit Costs Report (2007) Sarah Byford and Matthew Fiander summarised why it’s important to record the amount of time professionals spend on different activities or clients and how this can be collected. Their article focuses on complex health and social care services in which the cost of care packages are calculated for different client groups. These often involve many professionals who spend different amounts of time with patients/clients, and therefore this needs to be taken into account in the cost. Too much time allocated to a hospital consultant, for example, would show the service to be more expensive than it actually is. This could, in the worst case scenario, mean that the service is not found to be cost-effective.
Sometimes, we may simply need to compare how much it costs for a GP and a nurse to treat a patient with a view to nurses taking on more of GP’s roles. In this case, your luck is in as we have current patient-related costs for both of these professionals! Tables 1 and 2 show how these ratios have been estimated using a GP as an example. Once we have the ratios, multipliers are then used to allocate time. It is important to note that we rarely, if ever, have a complete breakdown of time and make the assumption that all time relates directly or indirectly to patient care unless we have clear evidence otherwise. Thus for example, study days, general administrative tasks and attendance at conferences are all assumed to be overheads on patient care.
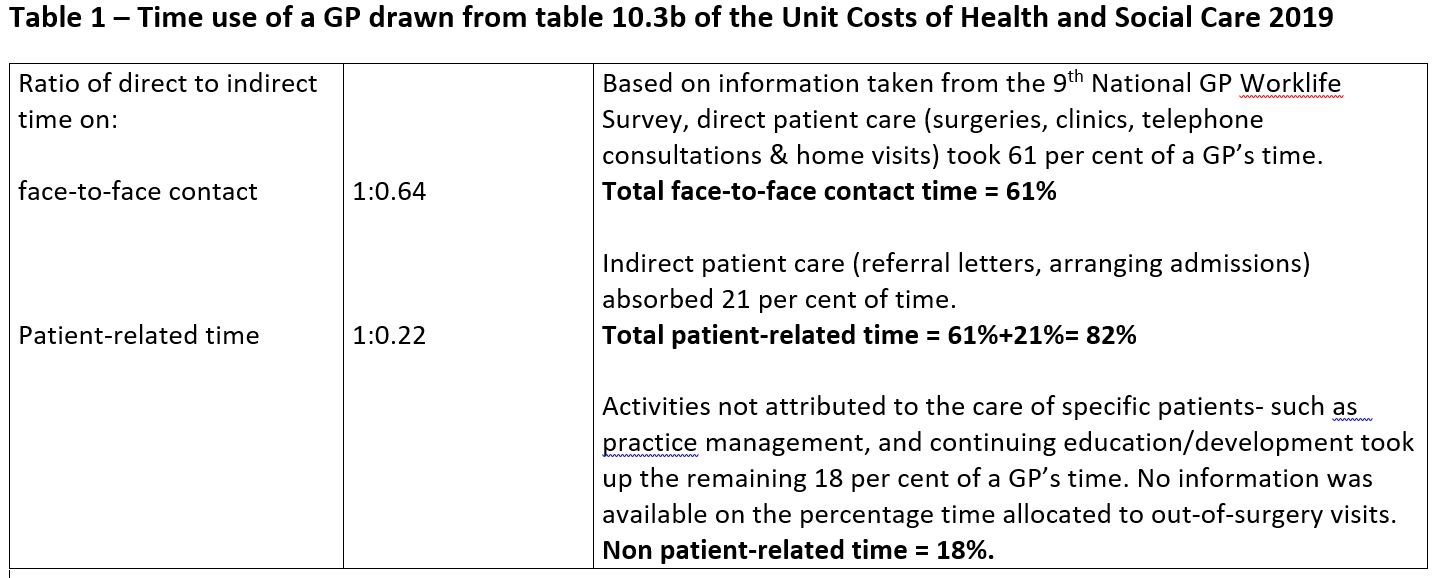
Having a breakdown of how professionals spend their time is the first step to creating these multipliers and Sarah Byford and Matthew Fiander’s article lists methods used to collect this information. For GPs, information is updated every 2-3 years and is published in the National GP Worklife Surveys. For nurses, Ball & Philippou’s 2013 survey was helpful. We also have a ratio and cost for alcohol health workers/alcohol liaison nurses (3.3) and a clinical psychologist (coming in our 2020 edition) thanks to new research.
How do we compare costs between professionals when these ratios aren’t available?
In 2015, an absence of time-use information for most professionals led us to carry out our own survey. Unfortunately, due to the demands on the time of care professionals, the response rate was poor which meant that sample sizes weren’t representative. Nevertheless, the results of this survey are kept in chapter 20- Time Use of Community Care Professionals for you to use at your discretion, and you will see that those professionals who responded gave us a detailed breakdown. Other ratios which have been superseded by new work or are simply more than ten years old are also kept in this chapter.
Occasionally we are asked why we don’t use these old ratios to estimate unit costs. One of our key aims is to keep our costs current and we have a ten year deadline for this purpose. Over a ten year period, services may change possibly as a result of new government directives to free up time so that professionals can spend more time with patients. With more efficient administration, more patients can be seen, waiting times can be reduced, and consequently the cost per patient-related hour reduces. A time limit on the ratios is therefore important. Of course, not having like-for-like comparisons for all professionals makes comparing patient-related unit costs difficult and in this case, it would be advisable to use the standard cost per hour. If you know that services haven’t changed in the ten year period, you could if you wish choose to use the ratios in chapter 20.
You deserve another cat nap here – but just one last thing – please let us know if you are aware of any research or studies we may have missed and we will check them out to see if they will help us (L.A.Curtis@Kent.ac.uk; A.L.Burns@Kent.ac.uk).
This study/project is funded by the National Institute for Health Research (NIHR) [Policy Research Programme, Unit Costs of Health and Social Care, 035/0093.]. The views expressed are those of the authors and not necessarily those of the NIHR or the Department of Health and Social Care.